Custom alerts and data visualization let you quickly identify and prevent interruptions of Windows services and the critical applications that rely on them.
Many critical applications such as Active Directory, SharePoint, and Exchange can only run smoothly if the Windows services they rely on work as expected. If a service stops without you realizing it, there’ll sure as hell be angry end users. Paessler PRTG gives you a comprehensive view of the performance of your Windows services and alerts you in real time if there is an issue so that you can step in and save the day.
With PRTG’s easy-to-understand dashboards, you can see at a glance if your Windows services are up and running or if there’s unplanned downtime.
Drill down to the root cause of an issue to fix it quickly, and even prevent disruptions before they happen with custom warning and error thresholds.
PRTG provides you with valuable metrics on how much resources are being utilized by your Windows services.
This way, you can make informed decisions on capacity planning, allocating more bandwidth and memory to specific Windows servers or buying more hardware.
Make sure that suspicious activity like network traffic spikes, unauthorized logins, or hijacked Windows services do not go undetected.
Or set up our network monitoring tool to check for open and closed ports and ensure that malware doesn’t infiltrate your network.
PRTG’s custom alerting lets you set your preferred performance thresholds and choose from various notification methods such as SMS, email, or in-app push notification.
Need more automation? With the possibility to run custom PowerShell scripts, you can also let PRTG restart a Windows service that has stopped unexpectedly.
Diagnose network issues by continuously tracking the availability and performance of Windows services as well as Windows event logs and other endpoints to detect critical issues. Show uptime, CPU usage, bandwidth utilization, request execution time, and other key metrics in real time. Visualize monitoring data in clear graphs and dashboards to identify problems more easily. Gain the overview you need to troubleshoot service disruptions, authentication issues, and other problems in your network infrastructure.

Device tree view of the complete monitoring setup

Custom PRTG dashboard for keeping an eye on the entire IT infrastructure
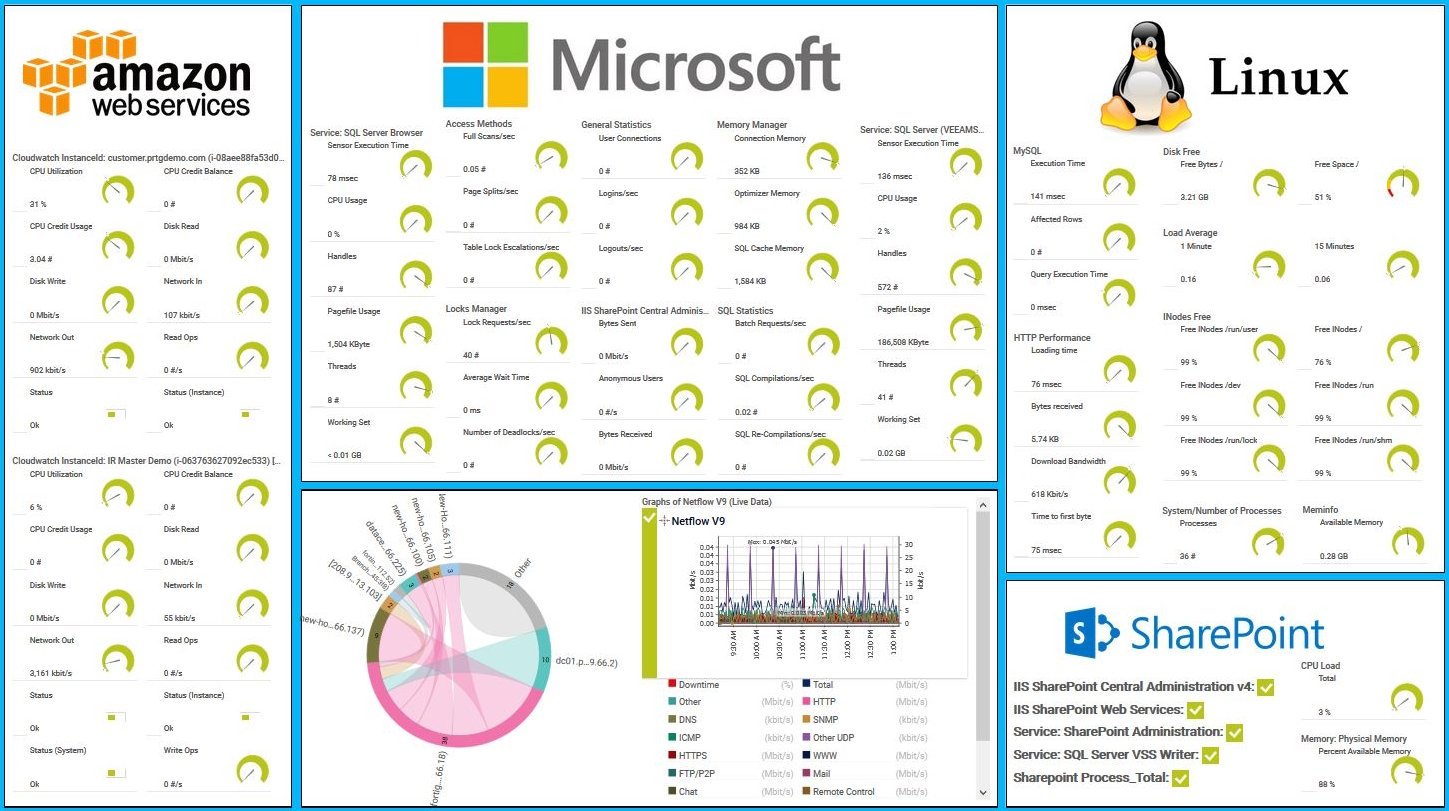
PRTG Dashboard – Unified Monitoring of AWS, Microsoft, Linux, and SharePoint Systems

Live traffic data graph in PRTG
“All-around winning
network monitor”
“The real beauty of PRTG is the endless possibilities it offers”
“PRTG Network Monitor
is very hard to beat”
PRTG comes with more than 250 native sensor types for monitoring your entire on-premises, cloud, and hybrid cloud environment out of the box. Check out some examples below!
The WMI Service sensor monitors a Windows service. It can show the following:
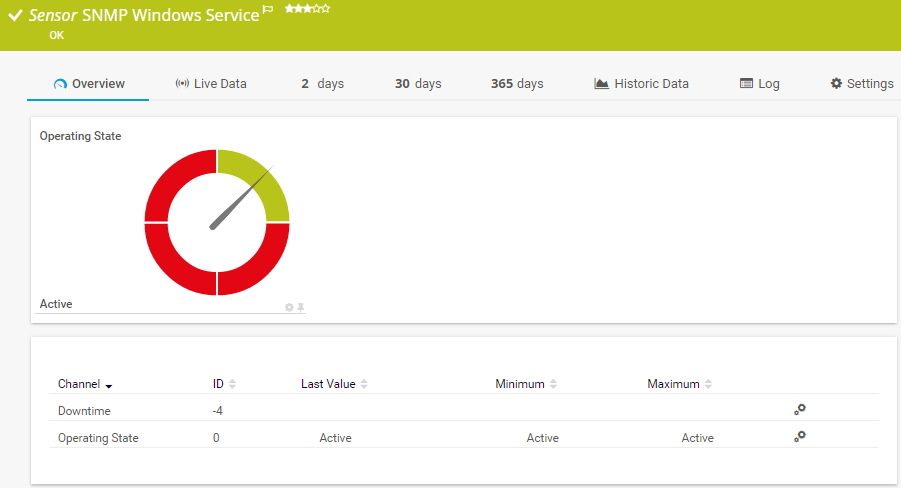
The SNMP Windows Service sensor monitors a Windows service. It can show the following:
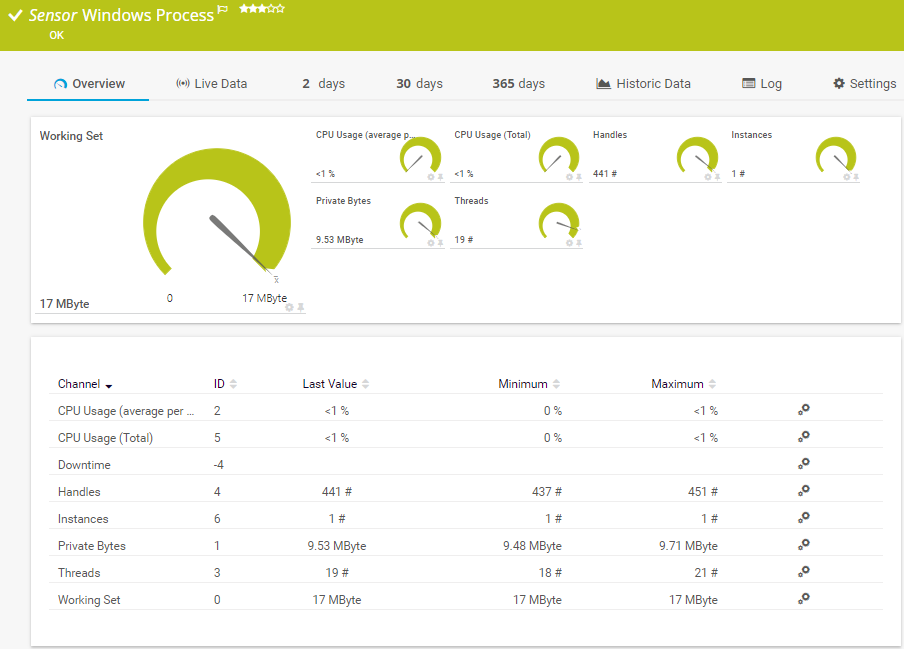
The Windows Process sensor monitors a Windows process via Windows Management Instrumentation (WMI) or Windows performance counters. It can show the following:
See the PRTG Manual for a list of all available sensor types.

Custom alerts and data visualization let you quickly identify and prevent interruptions of Windows services and the critical applications that rely on them.
PRTG is set up in a matter of minutes and can be used on a wide variety of mobile devices.


“Excellent tool for detailed monitoring. Alarms and notifications work greatly. Equipment addition is straight forward and server initial setup is very easy. ...feel safe to purchase it if you intend to monitor a large networking landscape.”
Partnering with innovative IT vendors, Paessler unleashes synergies to create
new and additional benefits for joined customers.
Combining PRTG’s broad monitoring feature set with IP Fabric’s automated network assurance creates a new level of network visibility and reliability.
Paessler and Plixer provide a complete solution adding flow and metadata analysis to a powerful network monitoring tool.
With ScriptRunner Paessler integrates a powerful event automation platform into PRTG Network Monitor.
Real-time notifications mean faster troubleshooting so that you can act before more serious issues occur.
Network Monitoring Software – Version 26.1.116.1532 (February 9th, 2026)
Download for Windows and cloud-based version PRTG Hosted Monitor available
English, German, Spanish, French, Portuguese, Dutch, Russian, Japanese, and Simplified Chinese
Network devices, bandwidth, servers, applications, virtual environments, remote systems, IoT, and more
Choose the PRTG Network Monitor subscription that's best for you


A Windows service is a special type of application in the Windows operating system that runs in the background, typically without a user interface, and performs specific functions or tasks. These services are designed to start automatically at system startup (or on demand) and can operate even when no user is logged into the system.
Example use cases include:
Windows service monitoring refers to the practice of tracking and managing the health, performance, and availability of Windows services to ensure they function correctly and meet operational requirements. Since Windows services often run critical system and application processes in the background, monitoring them helps detect and resolve issues proactively before they disrupt users or business operations.
Windows service monitoring is important for several reasons, including:
Absolutely. PRTG comes with preconfigured SNMP and SSH sensors to monitor your entire Linux/Unix environment, including hardware, applications, services, and server monitoring.
In PRTG, “sensors” are the basic monitoring elements. One sensor usually monitors one measured value in your network, for example the traffic of a switch port, the CPU load of a server, or the free space on a disk drive. On average, you need about 5-10 sensors per device or one sensor per switch port.
Paessler conducted trials in over 600 IT departments worldwide to tune its network monitoring software closer to the needs of sysadmins. The result of the survey: over 95% of the participants would recommend PRTG – or already have.

Paessler PRTG is used by companies of all sizes. Sysadmins love PRTG because it makes their job a whole lot easier.
Bandwidth, servers, virtual environments, websites, VoIP services – PRTG keeps an eye on your entire network.
Everyone has different monitoring needs. That’s why we let you try PRTG for free.